Chii Remote Debugging Guide
How to Use Chii for Remote Mobile Debugging
Chii lets you inspect a mobile page from a desktop browser while the page runs on a phone or inside a WebView. It is useful when you need a larger debugging surface for console logs, elements, resources, and network behavior from a real device.
Quick answer: how does Chii remote debugging work?
Chii remote debugging works by loading a target script inside the mobile page and connecting it to a Chii server that you inspect from a desktop browser. The phone and desktop must be able to reach the same server. After the page connects, reproduce the bug on the phone and inspect console output, DOM state, resources, storage, and request behavior from the desktop UI.
When Chii is a good fit
Use Chii when a mobile debugging panel is too small, when the person reproducing the bug is holding the phone, or when you want a desktop inspection experience without relying on platform-specific WebView inspection. It is especially useful for cross-device collaboration and WebView-like pages that can load a remote debugging target script.
- A bug only appears on a real phone, but you want to inspect it from your computer.
- Safari Web Inspector or Chrome remote debugging is unavailable for the target WebView.
- You need to watch logs while another tester reproduces the issue.
- You want to compare mobile page state with desktop page state side by side.
Prepare a Chii debugging setup
1. Make the Chii server reachable
The mobile page needs to reach the Chii server. In a local network setup, confirm that the phone and computer are on the same Wi-Fi and that the server address uses a LAN IP, not only localhost.
# Example shape only. Use your chosen Chii setup.
chii start --port 8080

# The phone should load a target script from a reachable host:
http://192.168.1.20:8080/target.js
2. Inject the target script
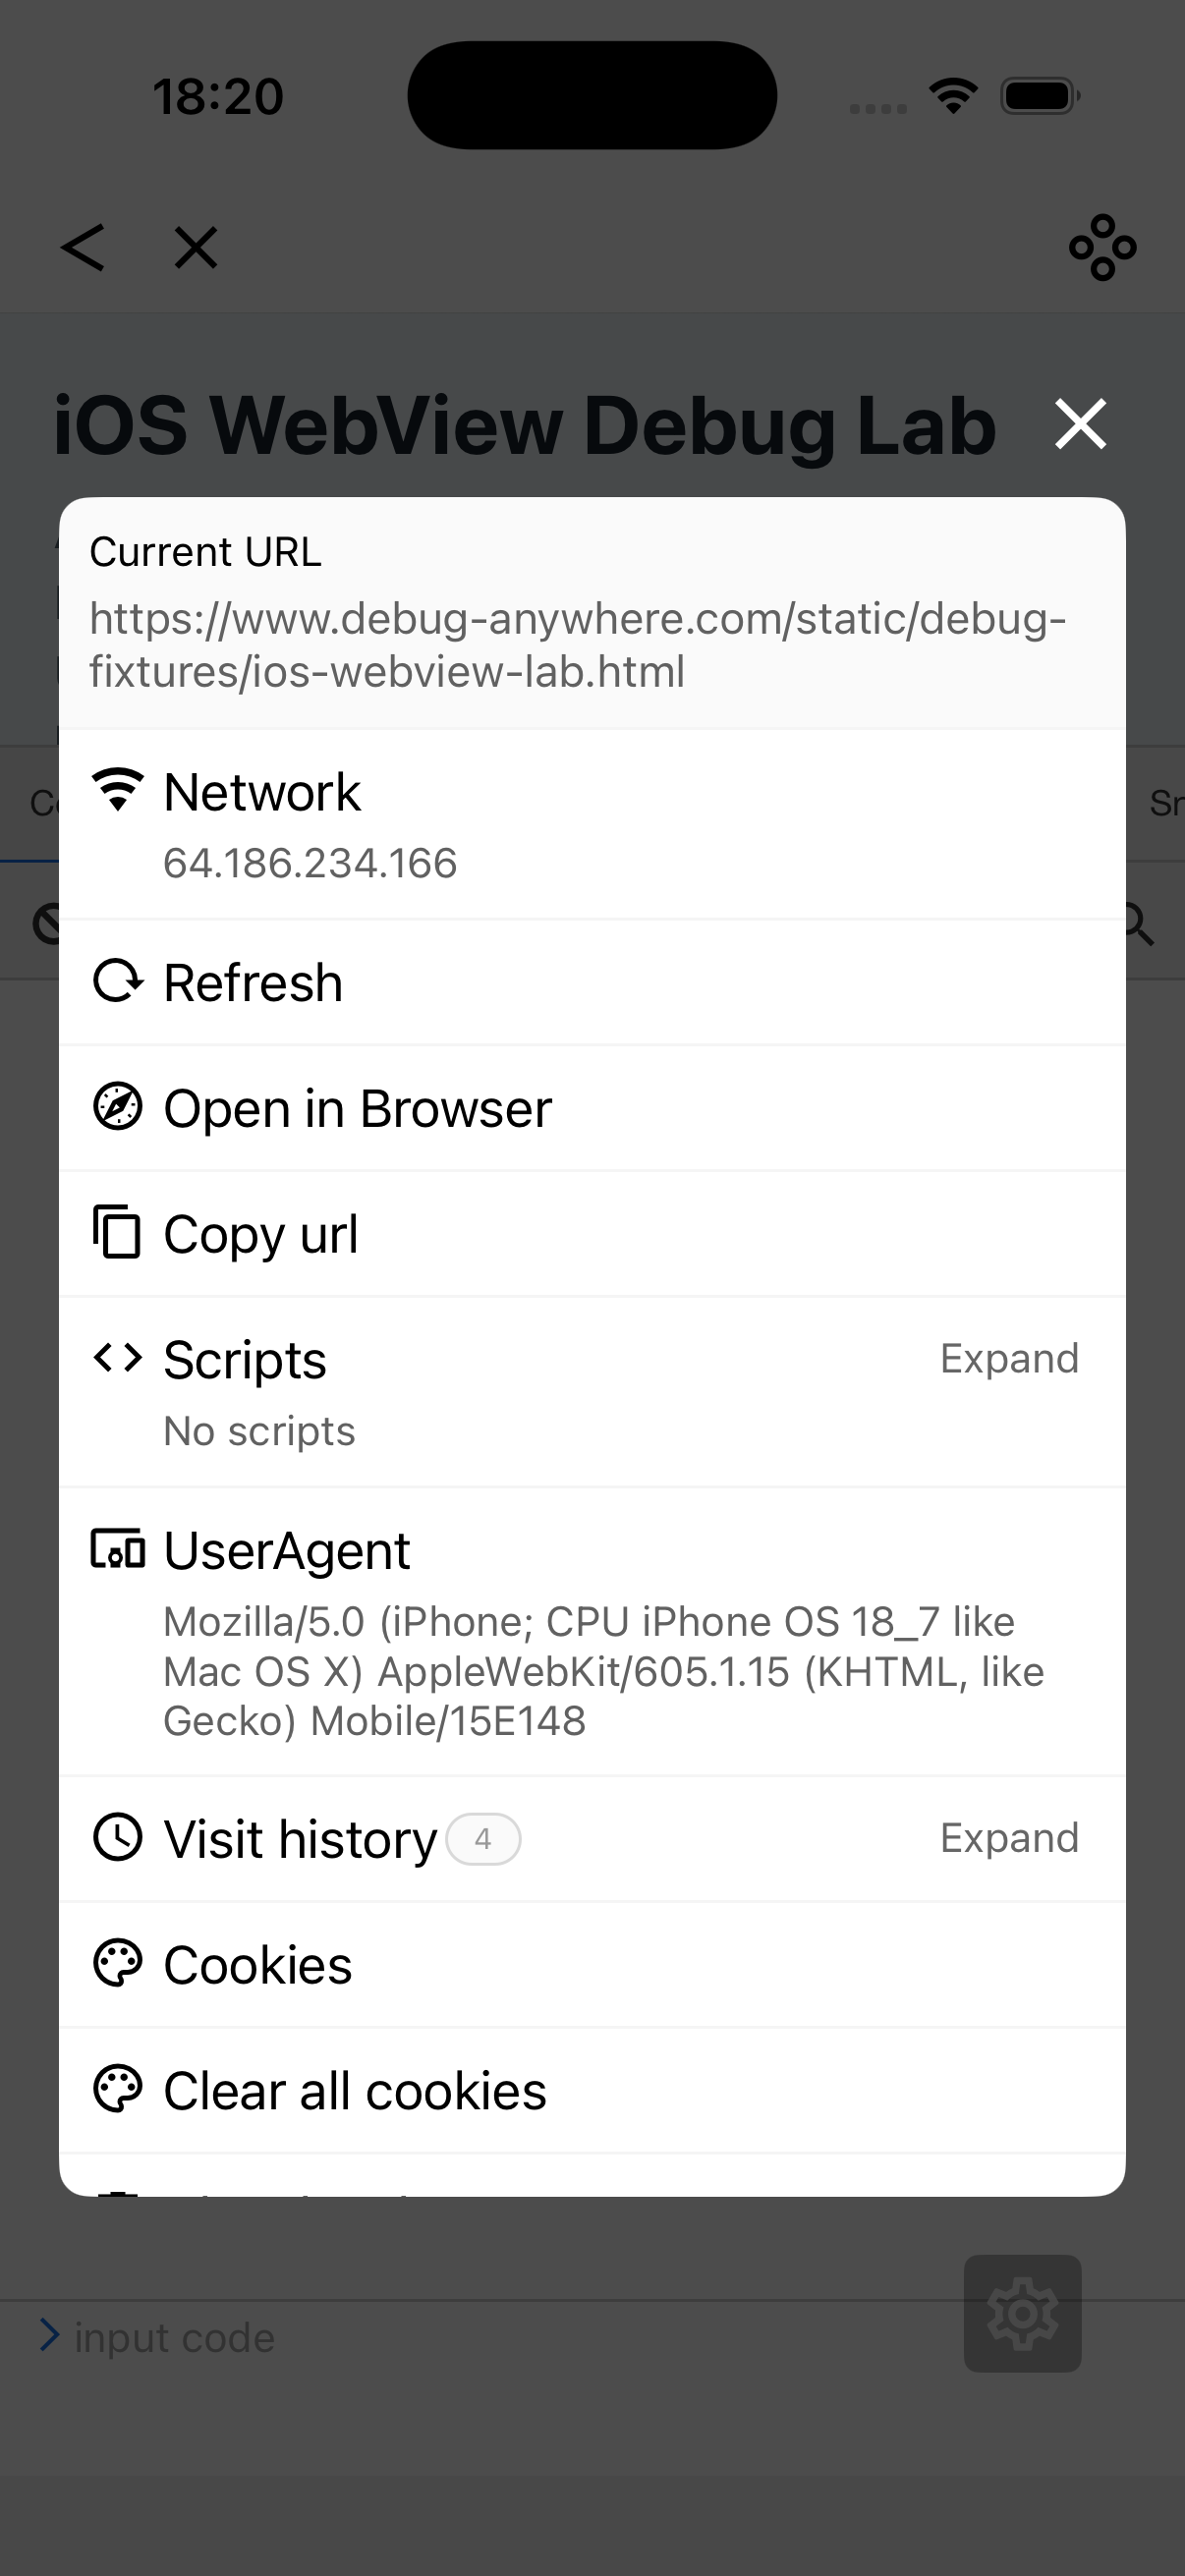
Load the Chii target script in the page you want to inspect. In development, you can add it behind a debug flag. For WebView-like testing, DebugAnywhere can help you open the URL and inject debugging scripts without changing the app release build.
3. Open the desktop inspector
Once the phone page connects, open the Chii web inspector from your desktop. Name the device, URL, account, and reproduction steps so you do not inspect the wrong tab or stale session.
Remote mobile debugging workflow
1. Verify the connection before reproducing
Open a simple page first and confirm that console messages appear on the desktop inspector. If nothing appears, fix network reachability, firewall rules, HTTPS restrictions, or the injected script URL before testing the real bug.
2. Capture runtime context
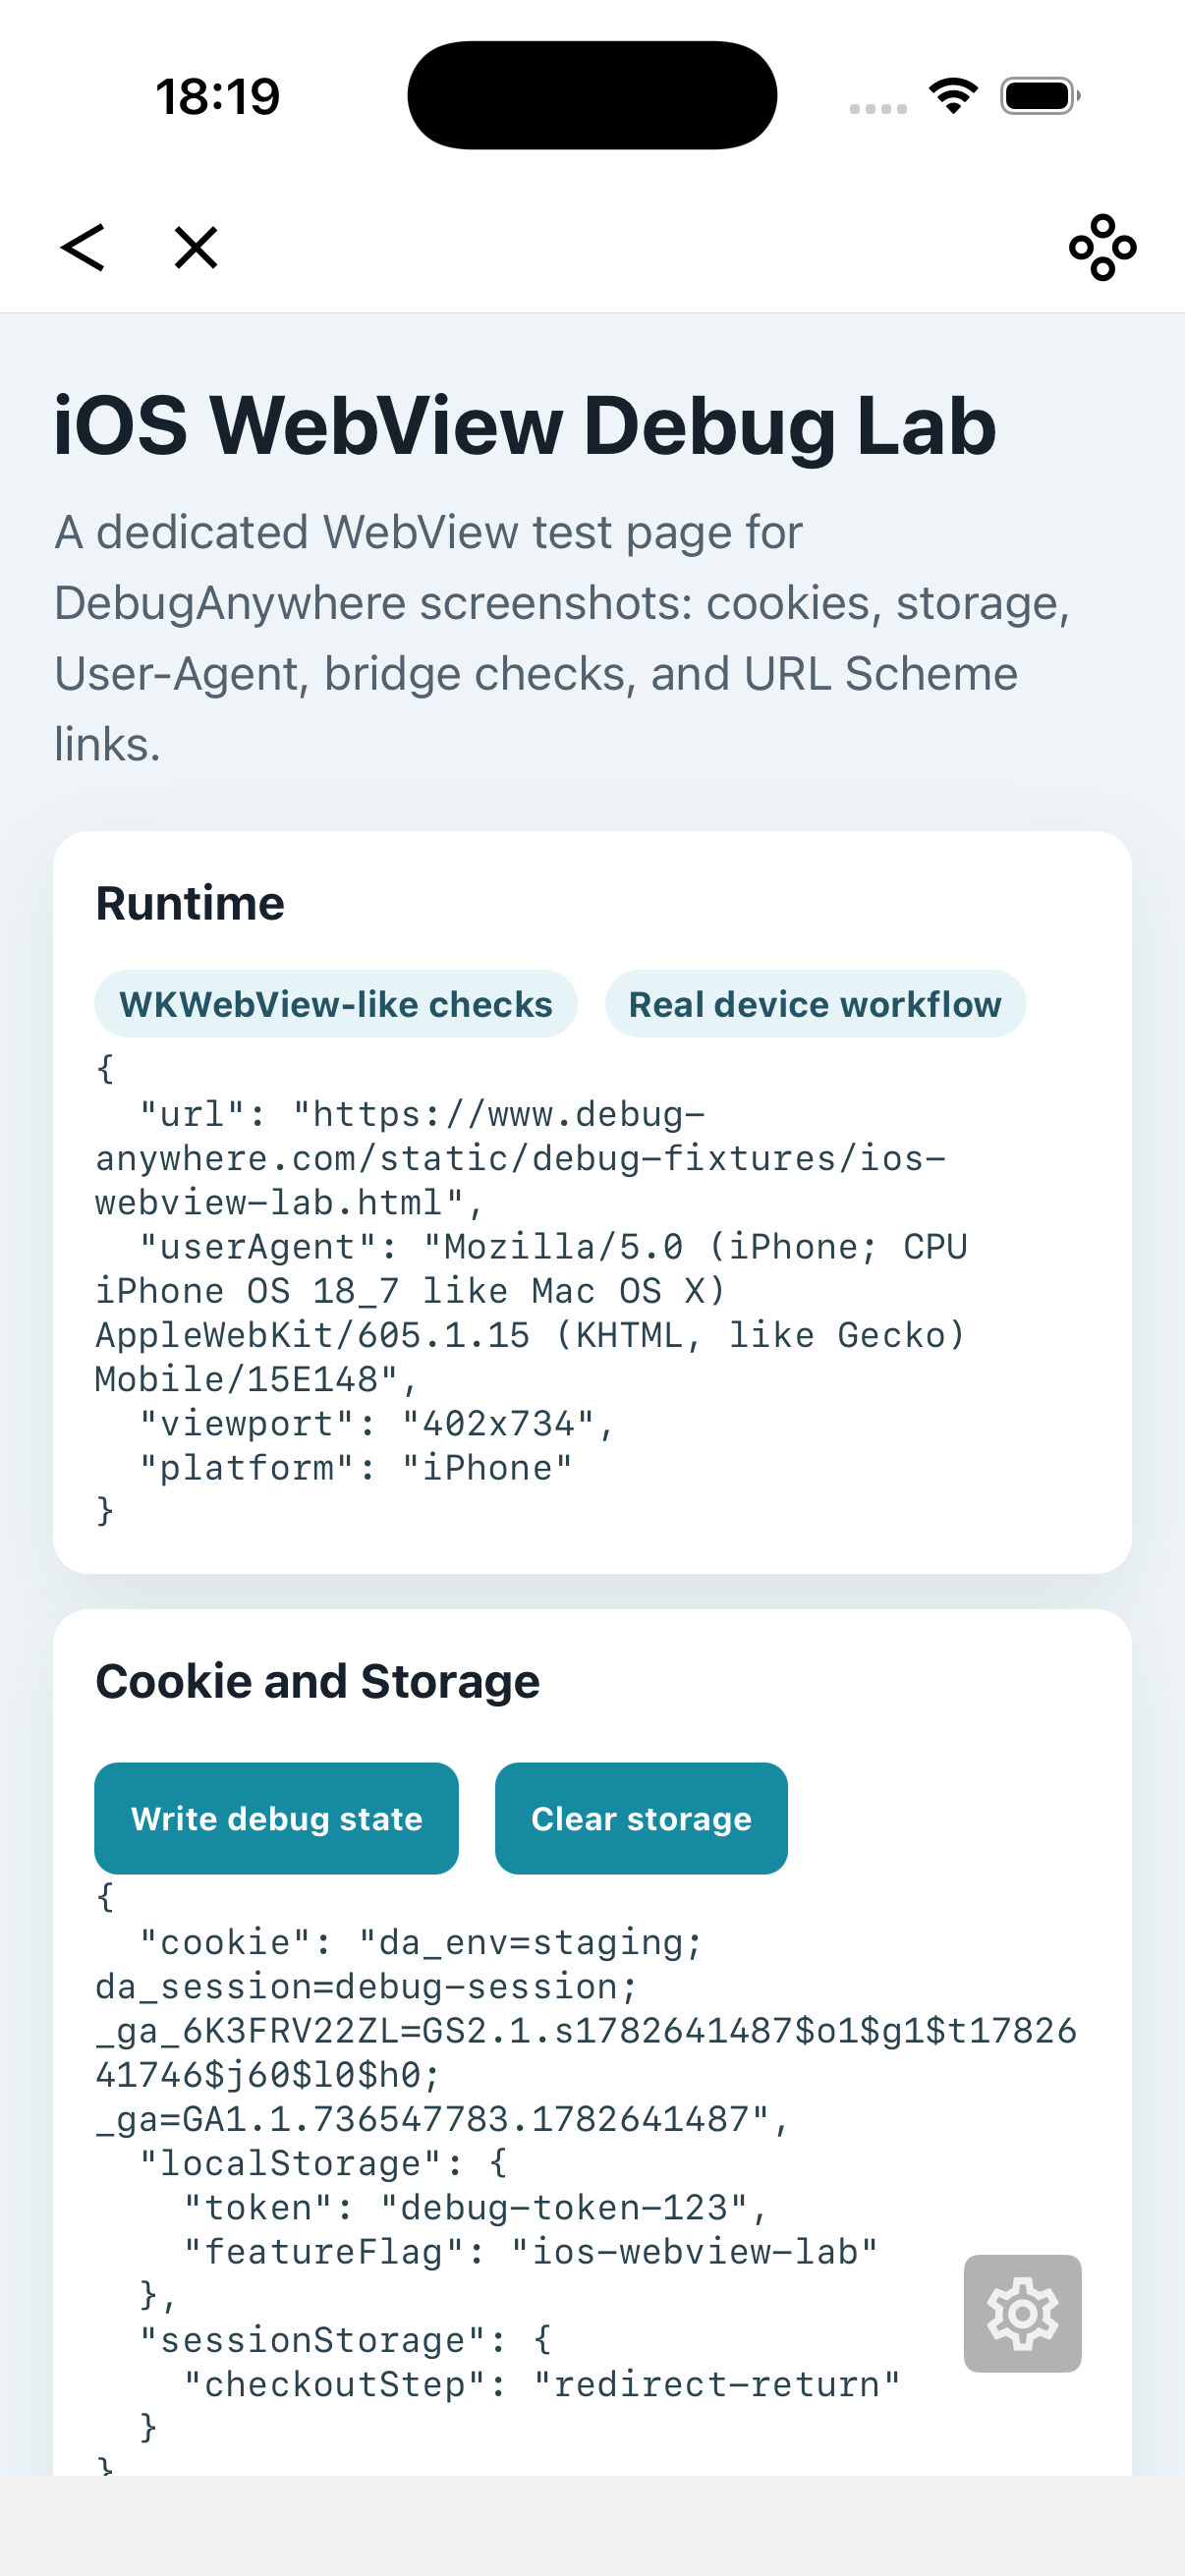
Log the current URL, User-Agent, viewport, cookie length, and any app bridge objects. This prevents a common failure where the desktop inspector is connected, but the page under inspection is not the same runtime where the bug occurs.
console.table({
    href: location.href,
    userAgent: navigator.userAgent,
    width: innerWidth,
    height: innerHeight,
    cookieLength: document.cookie.length
});
3. Reproduce slowly and watch the first failure
With remote debugging, it is tempting to inspect everything. Start with the first visible failure: the first console error, first failed request, first missing DOM node, or first storage value that differs from expectation.
4. Compare remote and local signals
If Chii shows the page is healthy but the user still sees a failure, inspect native WebView behavior separately. The issue may be navigation interception, external scheme handling, keyboard state, or a native JSBridge callback that does not appear as a normal page error.
5. Close the session after debugging
Remote debugging scripts should not stay active in normal user sessions. Remove the injected script, close the Chii session, and avoid leaving debug flags in shared links.
Common Chii remote debugging failures
| Symptom | Likely cause | Fix |
|---|---|---|
| Phone never appears in the inspector | Server is not reachable from the phone | Use a LAN IP, check Wi-Fi, firewall, and port |
| Target script fails to load | Mixed content, HTTPS policy, wrong URL, or blocked network | Use a reachable HTTPS endpoint or trusted local setup |
| Logs appear but network is incomplete | Page-side instrumentation cannot see every native-layer request | Compare with server logs, proxy, or WebView request hooks |
| Inspector shows the wrong page | Old tab or stale WebView session is still connected | Reload, label sessions, and close unused targets |
Chii remote debugging checklist
- Can the phone reach the Chii server URL?
- Does a test console.log appear in the desktop inspector?
- Are you inspecting the same URL and User-Agent where the bug occurs?
- Did you capture the first console error or failed request?
- Could the bug be caused by native WebView navigation, bridge code, or URL Scheme handling outside the page?
- Did you remove the remote debugging script or flag after testing?
Use DebugAnywhere with remote debugging workflows
DebugAnywhere helps you open the target URL on a real device, inject debugging scripts, check runtime state, compare User-Agent behavior, and validate cookies, storage, and URL Scheme flows before or during a remote debugging session.