Eruda Mobile Debugging Guide
How to Use Eruda for Mobile Web Debugging
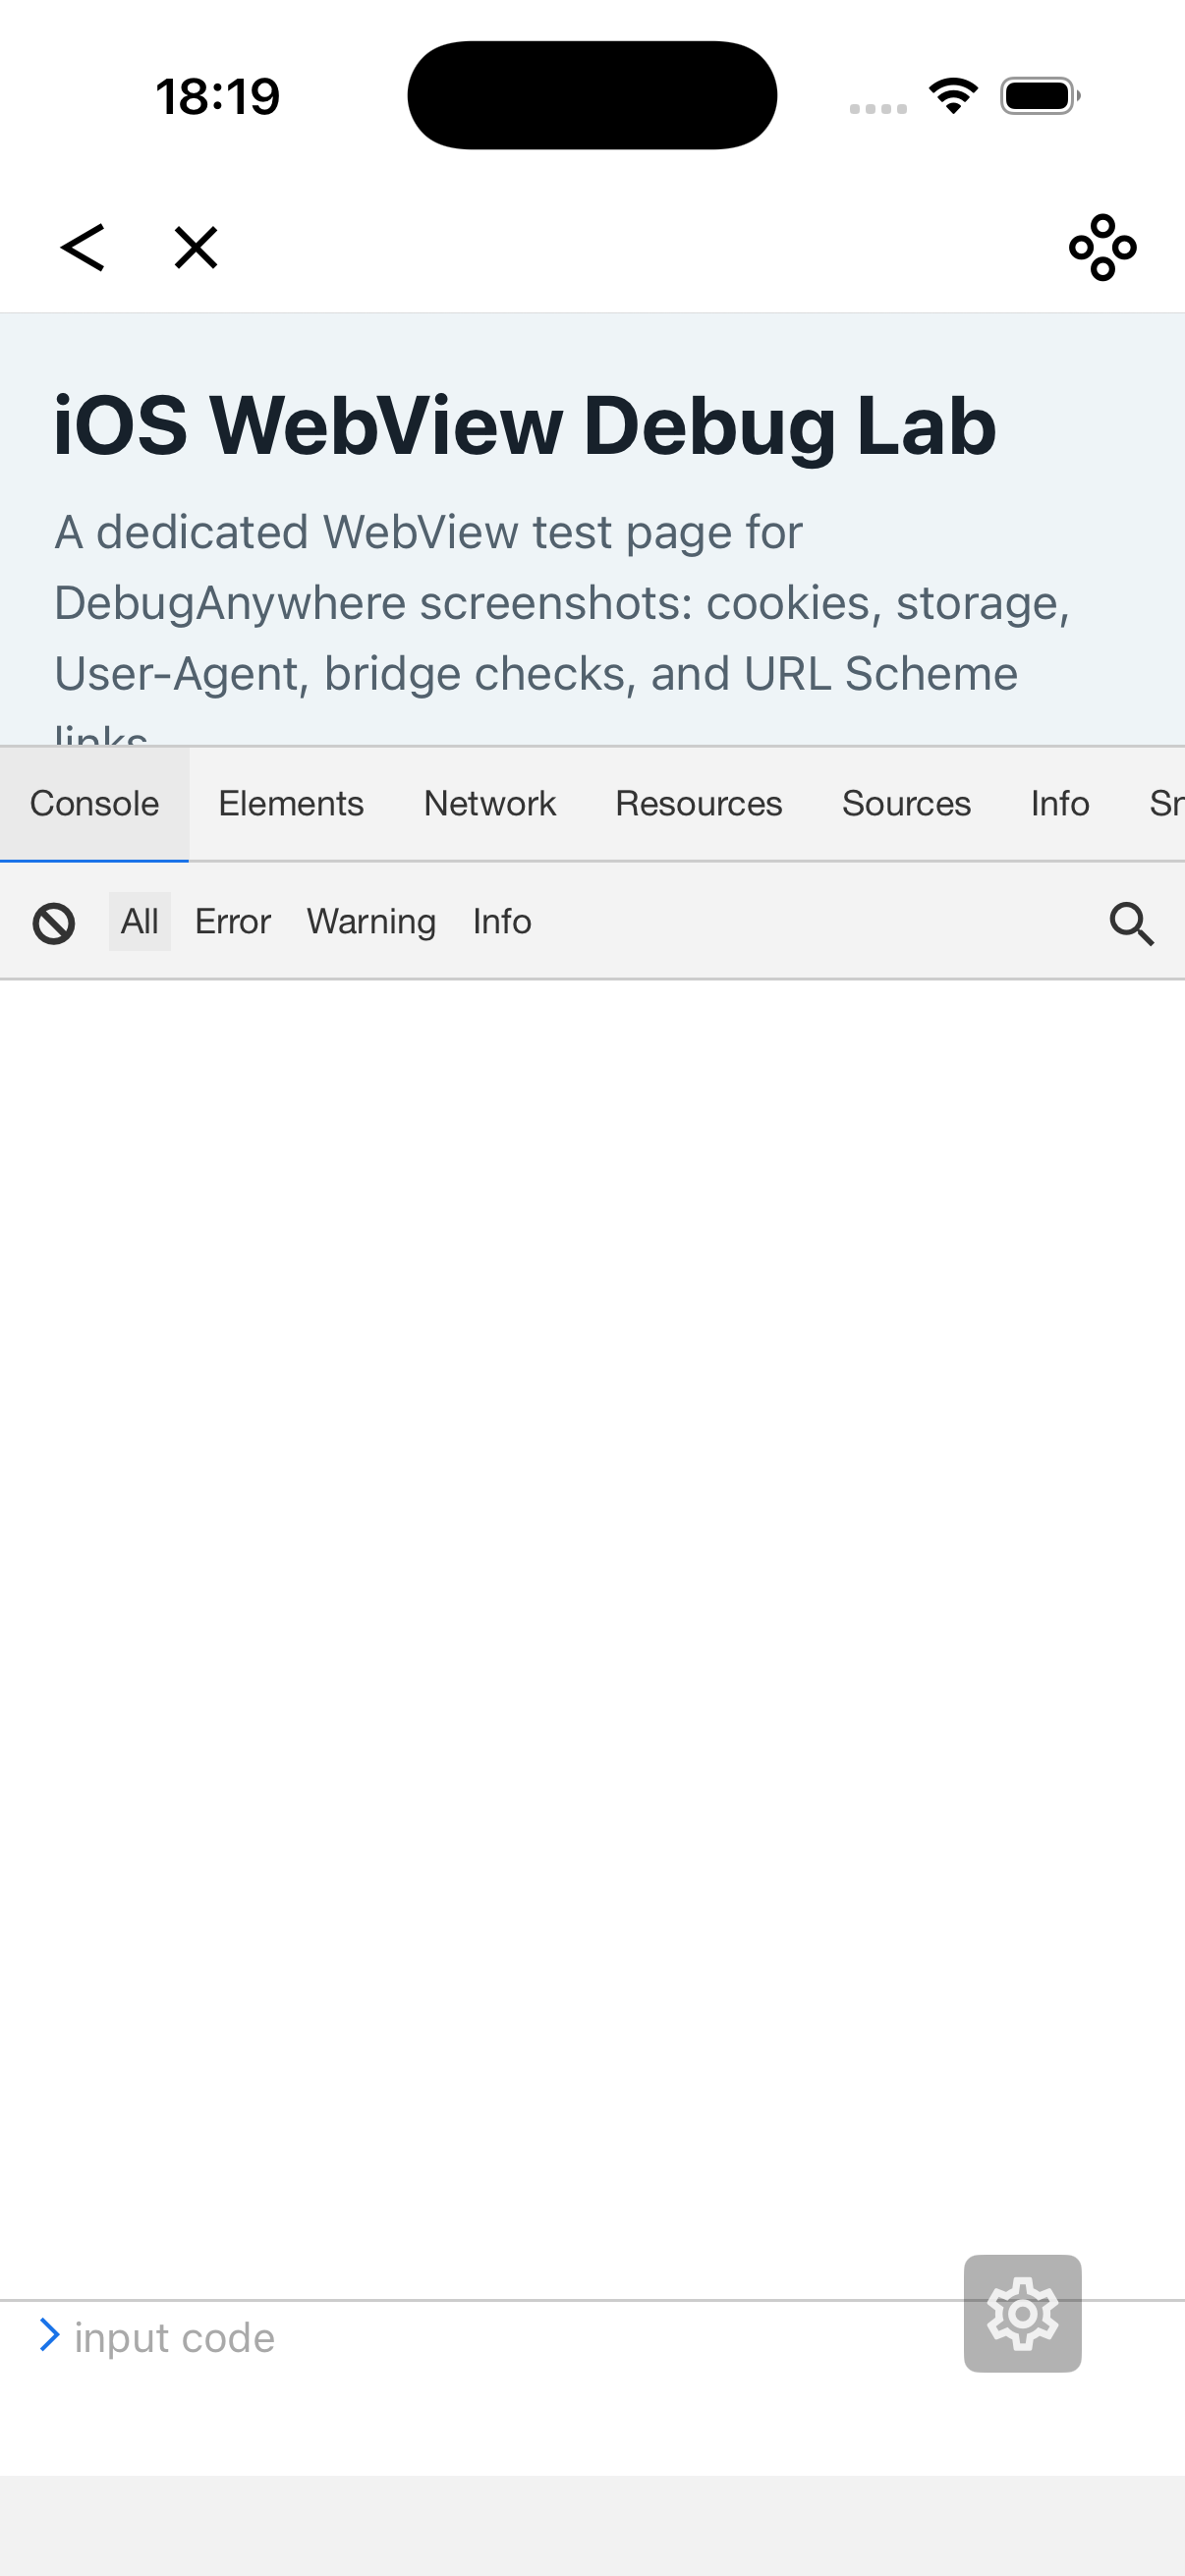
Eruda adds a DevTools-like panel directly inside a mobile page. It is useful when a bug only appears on iPhone, Android, or an app WebView and you need quick access to console logs, network activity, DOM state, cookies, storage, and runtime information.
Quick answer: what is the best way to use Eruda?
Use Eruda when you need page-side visibility on a real mobile device. Open the target URL on the phone, inject or load Eruda, reproduce the bug, then inspect the first console error, failed requests, cookie and storage state, DOM changes, viewport values, and runtime User-Agent. If the page is inside a WebView or the production page cannot be modified, use DebugAnywhere to open the same URL and load a debugging panel without changing the app build.
When Eruda helps most
Desktop responsive mode is useful, but it does not reproduce every mobile runtime difference. Eruda is most helpful when the bug depends on the device browser, in-app WebView, viewport, touch events, cookies, storage, or mobile-only JavaScript branches.
- The page works on desktop but fails on iPhone or Android.
- A mobile-only script throws an error before the UI finishes rendering.
- An API request fails only when the page is opened inside a WebView.
- Login state disappears after a redirect or reload.
- A fixed button, modal, or input behaves differently when the keyboard opens.
- You need to inspect localStorage, sessionStorage, cookies, or runtime User-Agent on the actual device.
Setup options
1. Add Eruda during development
If you control the page code, load Eruda only in development, staging, or behind a private debug flag. Do not expose a debugging console to every production user.
if (location.search.includes('debug=true')) {
    const script = document.createElement('script');
    script.src = 'https://cdn.jsdelivr.net/npm/eruda';
    script.onload = () => window.eruda?.init();
    document.body.appendChild(script);
}
2. Inject Eruda from a debugging container
When you cannot change the page bundle, open the page in a debugging app or WebView container that can inject the script for you. DebugAnywhere is built for this workflow: open the URL, enable the debug panel, then reproduce the issue on the device.
3. Use a test target first
If you are not sure whether the mobile debugging panel is working, open the site debug target at /debug. It can trigger console logs, fetch requests, cookies, localStorage, sessionStorage, geolocation, share, and runtime visibility changes.
Mobile Eruda debugging workflow
1. Reproduce the bug before inspecting
Record the device, browser or WebView, URL, account state, and entry point. Mobile bugs are often stateful, so note whether the page opened from a QR code, a push notification, an app link, or an internal WebView navigation.
2. Start with the Console panel
The first error usually explains the rest of the failure. Look for syntax errors, missing globals, blocked script loads, unhandled promise rejections, and JSBridge calls that fail because a native object is missing.
console.log('URL:', location.href);
console.log('UA:', navigator.userAgent);
console.log('Viewport:', window.innerWidth, window.innerHeight);
console.log('Cookie:', document.cookie);
3. Check Network and Resources
Confirm that JavaScript, CSS, images, and API requests return the expected status. On mobile, a wrong environment host, missing auth header, blocked redirect, or stale service worker cache can look like a rendering bug.
4. Inspect cookies and storage
Login and personalization bugs often come from cookie attributes, stale localStorage values, or a sessionStorage value that only exists in one navigation path. Clear storage, reload, and compare the before and after state.
5. Compare the same URL in another runtime
If the page fails in an app WebView, compare it with Safari or Chrome on the same device. If it only fails in the WebView-like runtime, compare User-Agent, cookies, storage, injected scripts, and navigation interception.
Common findings in Eruda
| Finding | What it often means | Next check |
|---|---|---|
| First console error appears before render | Boot script, dynamic import, or missing runtime object failed | Script load order and mobile-only branches |
| API request returns 401 or 403 | Auth cookie, token, or environment header is missing | Cookie attributes and request headers |
| Storage has old values | Stale cache or previous account state affects the page | Clear localStorage, sessionStorage, and cookies |
| Viewport values differ from expectation | Layout depends on actual device, safe area, or keyboard state | CSS viewport units and fixed elements |
Eruda mobile debugging checklist
- Can you reproduce the bug on the real device?
- Did you capture the final URL and User-Agent?
- What is the first console error?
- Do all page assets and API requests return expected status codes?
- Do cookies and storage match the expected login state?
- Does the page behave differently after clearing cache and storage?
- Does Safari or Chrome on the same phone behave differently from the WebView?
Use DebugAnywhere to load a mobile debugging panel
DebugAnywhere helps you open a target page on a real device, inject a mobile debugging panel, inspect console output, check cookies and storage, switch User-Agent, clear state, capture screenshots, and compare WebView-like behavior without rebuilding the host app.