Mobile Web Debugging Guide
How to Debug Mobile H5 Pages on iPhone
iPhone-only H5 bugs are often caused by runtime differences rather than obvious code mistakes. This guide walks through a practical flow: reproduce the issue, inspect logs, check network requests, review storage, compare User-Agent behavior, and verify the page runtime.
When you should debug on a real iPhone
If a page only breaks on iPhone, inside an iOS WebView, or inside an in-app browser, desktop mobile emulation is usually not enough. A simulator can approximate screen size and parts of the User-Agent, but it does not fully match system WebKit behavior, touch events, keyboard resizing, cookie policies, app-injected JSBridge APIs, URL Scheme redirects, or the actual mobile network environment.
Move to a real-device debugging flow when you see cases like these:
- The page works on desktop but shows a blank screen, broken layout, or dead buttons on iPhone.
- Login state works in Safari but disappears inside an app WebView.
- API calls succeed on your computer but fail, time out, or hit a different environment on mobile.
- You need to simulate an app container by injecting JSBridge APIs, switching User-Agent, or applying page-load environment headers.
- You need to test app launching, payment redirects, deep links, or URL Schemes.
Prepare three things before debugging
First, keep a URL that can reproduce the issue reliably. Preserve the full query string instead of copying only the domain, because many H5 bugs come from campaign parameters, feature flags, environment parameters, or login callback values.
Second, record the runtime environment: iOS version, device model, entry app, network type, login state, proxy status, open time, and reproduction steps. Mobile bugs are easily affected by state, and a small environment note can save a lot of repeated checking.
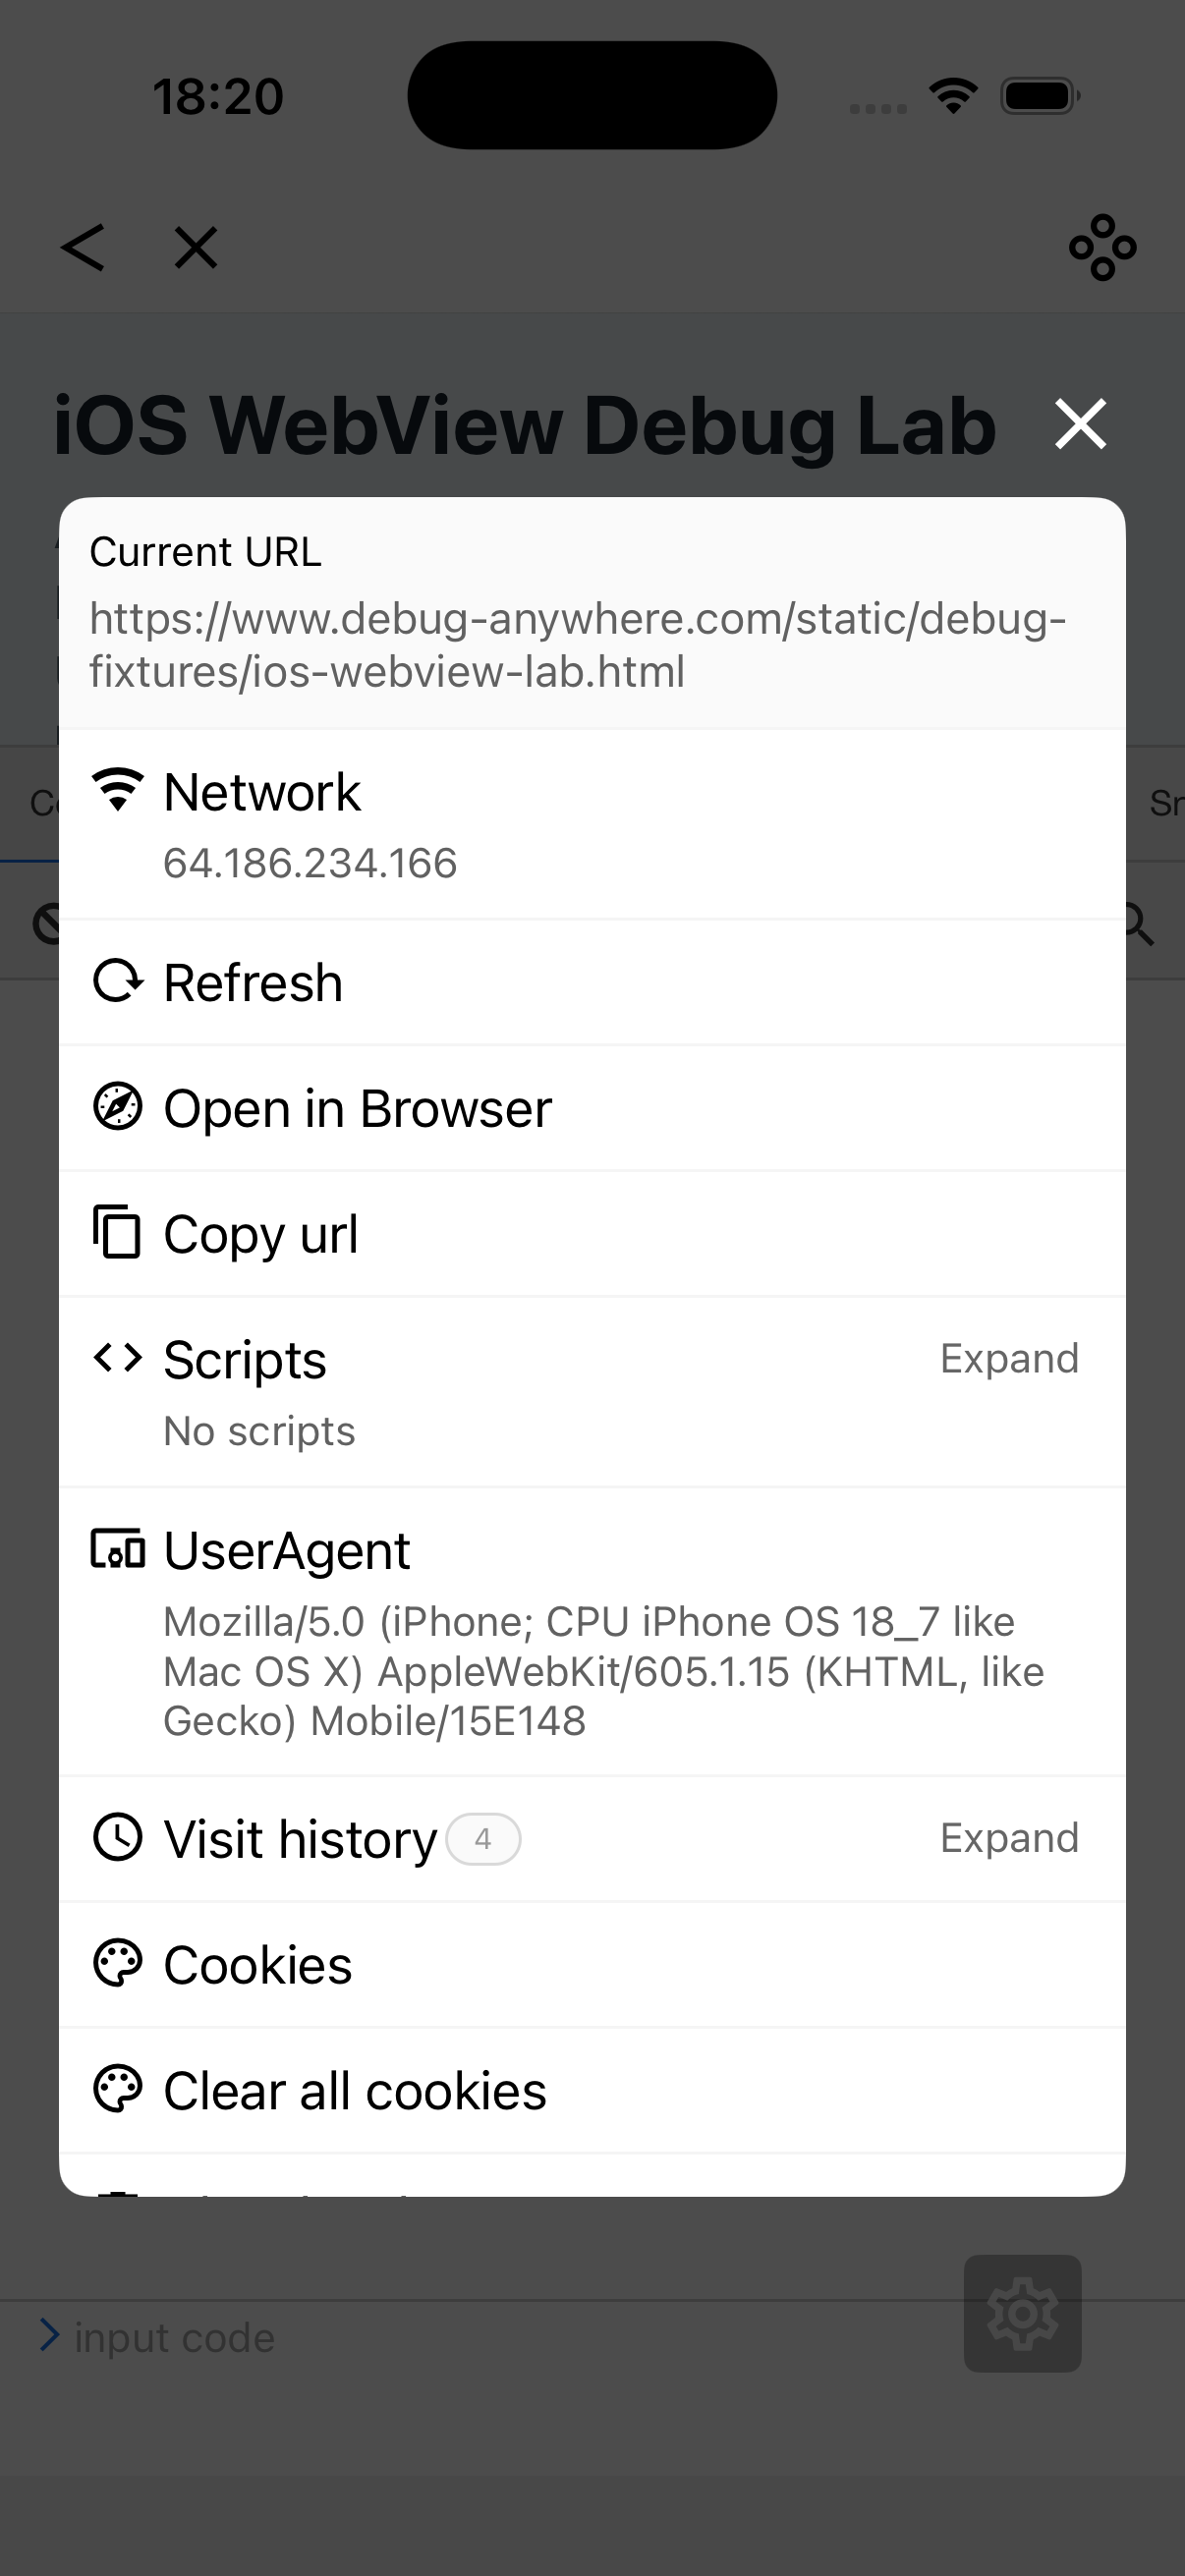
Third, use a tool that lets you inspect console logs, request behavior, and browser storage from the iPhone itself. You can use Safari Web Inspector, or a real-device tool like DebugAnywhere to open the page on the phone, inject a debugging panel, and run custom scripts.
A practical debugging workflow
1. Confirm the page actually loaded
A blank screen is not always a JavaScript exception. The HTML may not have returned, a static asset may be 404, an API may be blocking the first render, the route may not match, or the first screen may be hidden by safe-area or keyboard layout issues. Start by checking the document, main JavaScript bundle, and CSS files.
2. Read the console errors
Common iOS console clues include syntax compatibility issues, uncaught promises, failed resources, CORS errors, missing JSBridge objects, and storage access failures. Pay close attention to the first red error; later errors are often just fallout.
3. Inspect network requests
Check the API host, status code, method, request headers, response body, and timing with Safari Web Inspector, a proxy, or an injected debugging panel. On mobile, environment mismatches are especially common: a staging build may require app context, an app WebView may send a special User-Agent, and some APIs may rely on Cookie or Authorization headers.
4. Review Cookie, localStorage, and sessionStorage
Login-state bugs almost always involve storage. Check Cookie Domain, Path, SameSite, Secure, and expiration settings. Then inspect localStorage and sessionStorage for stale tokens, cached environment config, or old user state.
5. Switch User-Agent to reproduce app behavior
Many H5 pages branch on User-Agent: whether to show a download banner, enable a JSBridge path, or use app login. Try the page with a normal Safari User-Agent first, then switch to the target app User-Agent and compare UI behavior and API requests.
6. Use JavaScript injection to validate assumptions
When you suspect a runtime variable, method, or environment condition, inject a small script to verify it. You can print global config, mock a JSBridge response, update localStorage, listen to click events, or inject a lightweight polyfill early in the page lifecycle.
console.log('ua:', navigator.userAgent);
console.log('viewport:', window.innerWidth, window.innerHeight);
console.log('token:', localStorage.getItem('token'));
If the bug only happens inside an app WebView
WebView debugging is really about understanding what environment the app gives to the page. Besides page code, check whether the app injects a JSBridge, intercepts requests, rewrites User-Agent, sets cookies, allows external scheme navigation, or blocks mixed HTTP/HTTPS content.
If you cannot connect directly to the in-app WebView, reproduce a close environment in DebugAnywhere first: set the same User-Agent, apply required page-load headers, inspect cookies and storage, and inject a JSBridge mock. That helps you separate page logic problems from app-container problems.
iPhone H5 debugging checklist
- Is the full URL preserved, including query parameters?
- Did the HTML, JavaScript, and CSS files return 200?
- What is the first console error, and is it compatibility-related?
- Do request headers, cookies, and authorization values match expectations?
- Does User-Agent switching trigger a different code path?
- Does localStorage or sessionStorage contain stale state?
- Could the keyboard, safe area, scroll container, or fixed positioning break the layout?
- Are URL Schemes, payment redirects, or login callbacks blocked by the WebView?
Debug directly on iPhone with DebugAnywhere
DebugAnywhere lets you open mobile web pages on a real device, inspect console output and request behavior, check cookies and localStorage, switch User-Agent, inject custom JavaScript, and compare WebView-like environments. It is built for frontend developers, app developers, and QA engineers who need to locate mobile H5 issues quickly.