iOS WebView Debugging Guide
How to Debug iOS WebView Pages on Real Devices
iOS WebView bugs are often caused by differences between Safari, WKWebView, and the app container. This guide gives you a practical real-device workflow for checking console errors, network requests, cookies, storage, User-Agent branches, JSBridge behavior, and URL Scheme redirects.
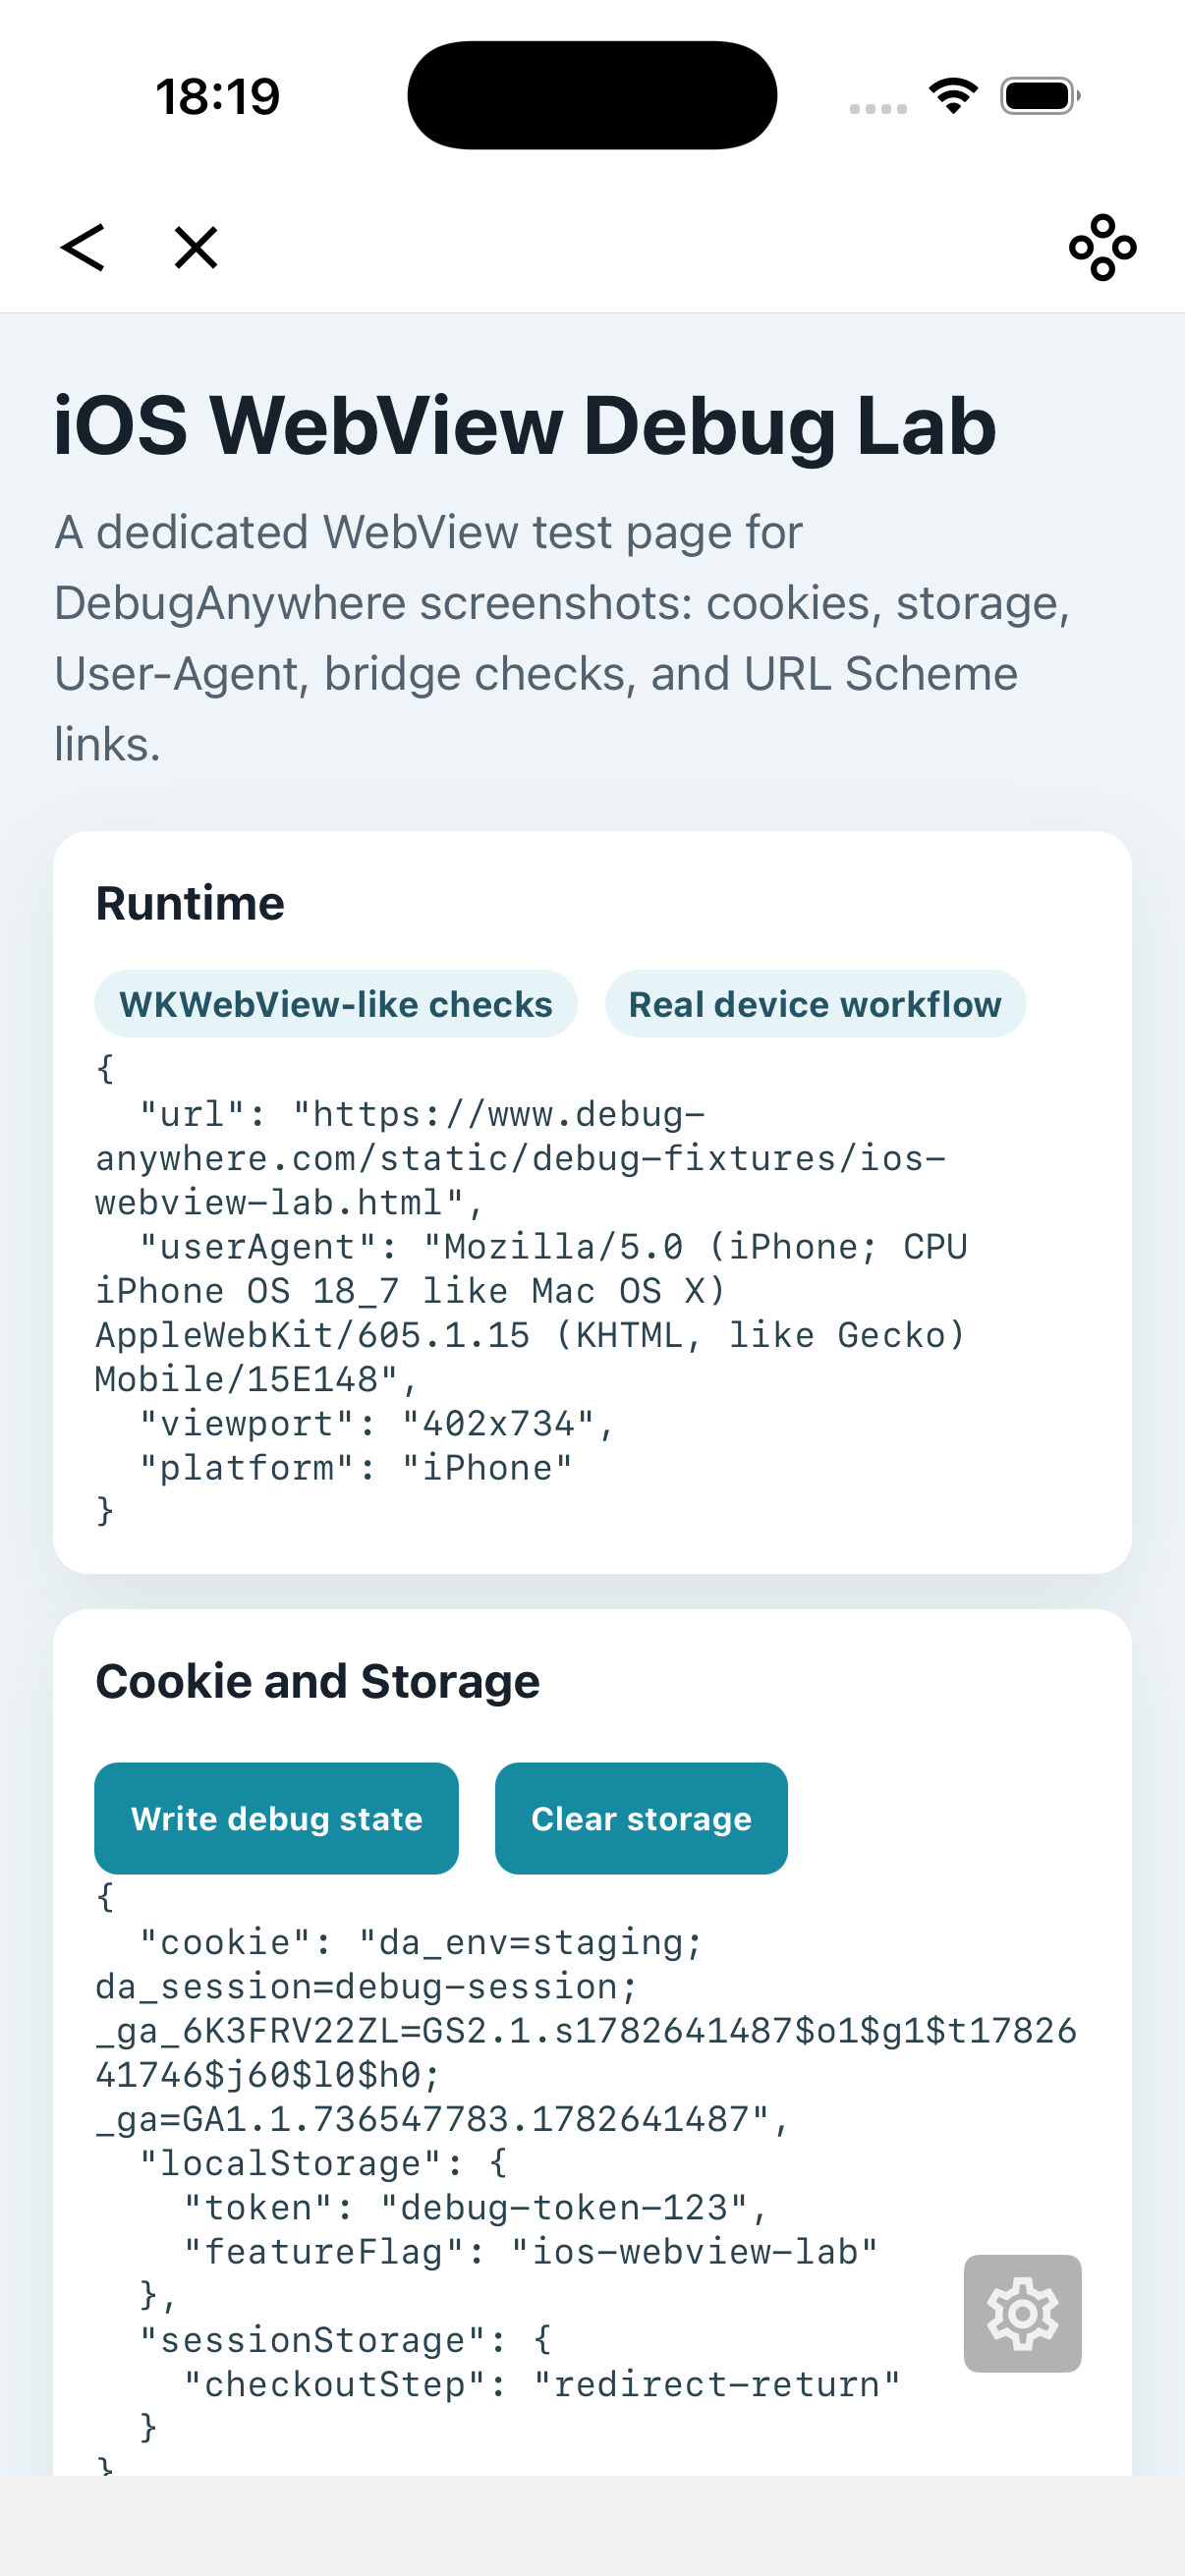
Quick answer: how to debug iOS WebView
To debug an iOS WebView page, reproduce the issue on a real iPhone, inspect console errors and request behavior, compare Safari behavior with WKWebView behavior, verify cookies and storage, then test app-specific behavior such as JSBridge calls, initial-load headers, User-Agent branches, and URL Scheme redirects. If direct WebView inspection is hard, reproduce the same URL in DebugAnywhere with a matching User-Agent, environment headers, storage state, and injected JavaScript.
When iOS WebView debugging matters
WKWebView uses WebKit like Safari, but the app can still change how the page behaves. The app may inject JavaScript, provide a JSBridge, override navigation, set cookies through native code, change the User-Agent, block external schemes, or open the same URL with a different login state.
Use a real-device iOS WebView debugging flow when you see these symptoms:
- The page works in Safari but breaks inside an iOS app WebView.
- Login succeeds in Safari but the WebView loses session state.
- API requests miss app-specific headers or hit the wrong staging environment.
- Buttons that call a JSBridge method do nothing on some iPhone models or iOS versions.
- Payment, OAuth, app login, or URL Scheme redirects fail after a WebView navigation.
- The layout changes only when the iOS keyboard opens, the safe area changes, or a fixed element is shown.
Prepare a reliable debugging setup
Start with a stable reproduction URL, the exact app version, iOS version, iPhone model, entry point, account state, and network type. iOS WebView bugs are often stateful, so write down whether the user is logged in, whether a proxy is active, whether the page opened from a push notification, and which link or button launched it.
If the WebView is inspectable, Safari Web Inspector can help you inspect the page from a Mac. If it is not inspectable, or if you need to test WebView-like settings outside the app, use a real-device tool such as DebugAnywhere to open the same URL, switch User-Agent, apply environment headers on the page load, inspect and clear cookies or storage, and inject scripts that mimic page-side runtime behavior.
A practical iOS WebView debugging workflow
1. Confirm the final loaded URL
iOS apps often rewrite or append parameters before opening a WebView. Check whether the final URL keeps the original query parameters, login callback values, feature flags, campaign parameters, and environment switches. A missing query parameter can look like a frontend bug even when the page code is correct.
2. Check console errors first
Look for JavaScript syntax errors, missing global objects, failed dynamic imports, blocked resources, unhandled promises, and JSBridge calls that throw because the native object is not ready. On iOS, the first console error is usually more useful than later errors caused by a broken initial render.
3. Inspect network requests and headers
Check the API host, status code, response body, request payload, and headers with Safari Web Inspector, a proxy, or an injected mobile debugging panel. iOS WebView pages often depend on app context such as app version, environment, tenant, authorization, experiment, or device identifiers. DebugAnywhere can apply configured headers when opening the page; verify separately whether your API calls also receive the headers your host app normally adds.
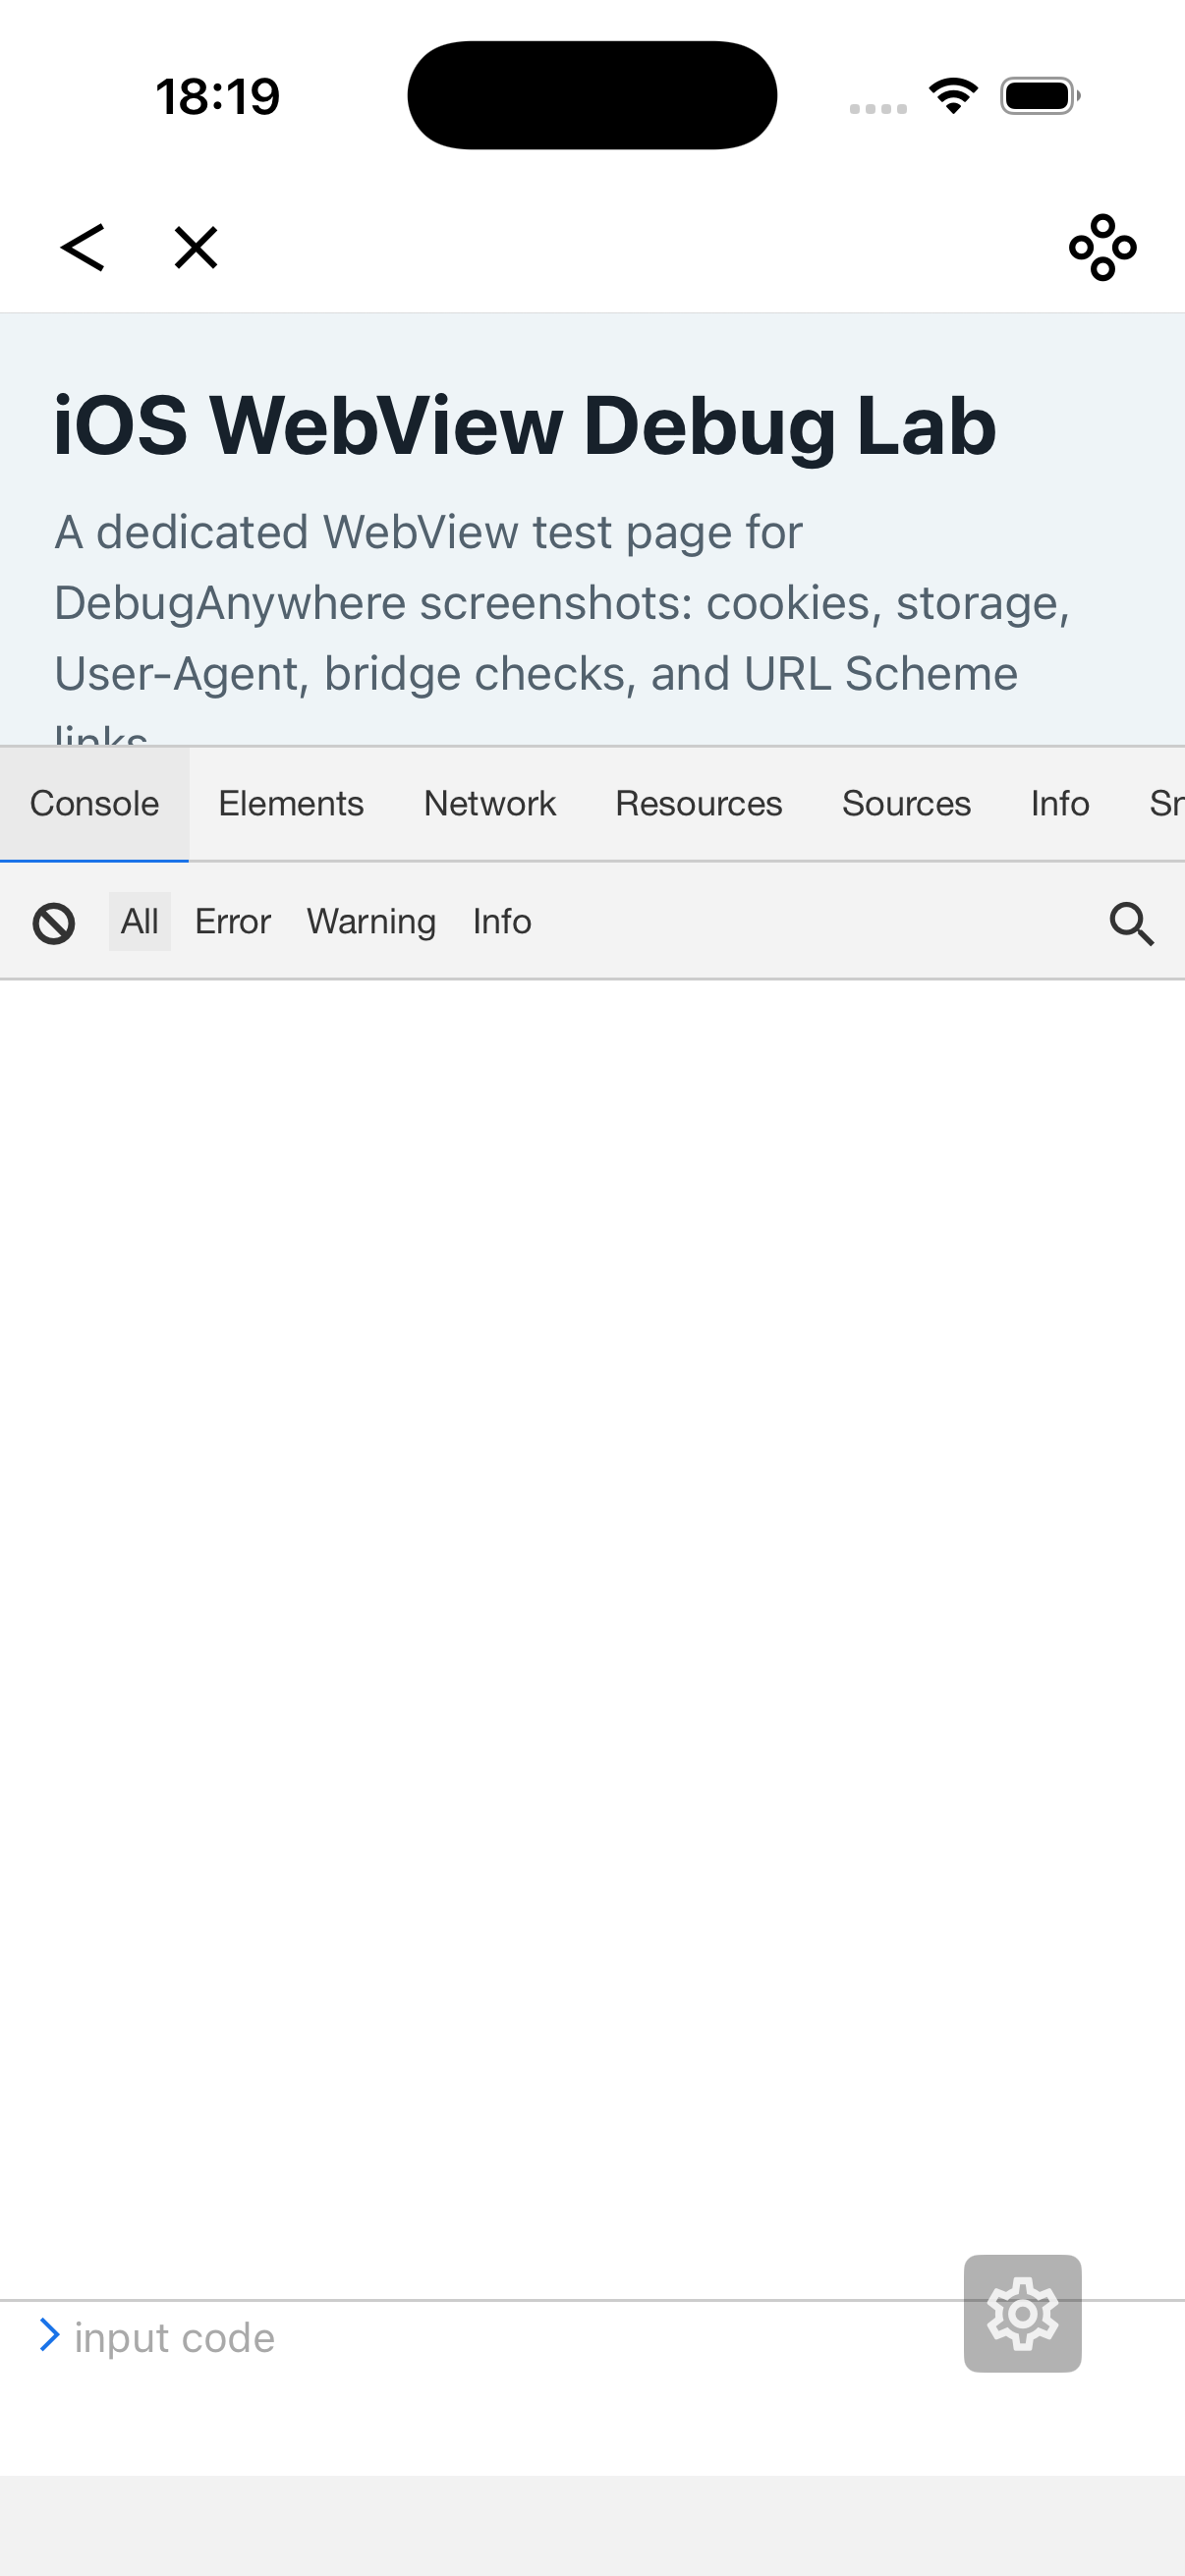
4. Verify cookies and storage
Login problems usually come from Cookie Domain, Path, SameSite, Secure, expiration, or native cookie synchronization. Compare cookies in Safari and the WebView-like environment. Then inspect localStorage and sessionStorage for stale tokens, cached config, or values written by a previous account.
5. Compare User-Agent branches
Many mobile pages decide behavior from User-Agent. They may show an install banner in Safari, enable JSBridge paths in the app, use different OAuth logic, or hide unsupported features. Capture the app WebView User-Agent and test the same page with that value.
console.log('User-Agent:', navigator.userAgent);
console.log('URL:', location.href);
console.log('Viewport:', window.innerWidth, window.innerHeight);
console.log('Cookie:', document.cookie);
6. Test JSBridge readiness
If the page talks to native code, check the timing contract. Some apps expose a bridge immediately, while others dispatch a ready event later. Inject a small script that logs available bridge objects before and after DOMContentLoaded, then test the exact method the page calls.
window.addEventListener('DOMContentLoaded', () => {
    console.log('webkit handlers:', Object.keys(window.webkit?.messageHandlers || {}));
});
7. Reproduce URL Scheme and redirect flows
Payment, OAuth, app login, and deep-link flows can fail because the WebView blocks external navigation, the app intercepts a scheme differently, or the redirect URL loses state. Test the scheme separately, then test it from the WebView page with the same query parameters.
Common iOS WebView failure patterns
| Symptom | Likely cause | What to check |
|---|---|---|
| Blank screen | JavaScript error, failed bundle, wrong route, or safe-area layout issue | Console, main JS request, final URL, viewport, safe-area styles |
| Login disappears | Cookie sync issue or storage mismatch | Cookie attributes, native cookie setup, localStorage token |
| API returns 401 or 403 | Missing authorization, app version, or environment header | Request headers and backend environment |
| Native action does nothing | JSBridge object missing or called too early | Bridge readiness, message handler name, iOS version differences |
| Redirect fails | Blocked external scheme or lost callback parameter | URL Scheme, navigation interception, callback URL |
iOS WebView debugging checklist
- Do you know the exact app version, iOS version, iPhone model, and entry point?
- Does the final loaded URL preserve all query parameters?
- What is the first console error?
- Do JavaScript, CSS, and API requests return the expected status codes?
- Are required app context headers present on the page load and relevant API calls?
- Do cookies match the expected Domain, Path, SameSite, Secure, and expiration values?
- Does the page choose a different code path with the app WebView User-Agent?
- Is the JSBridge or WKScriptMessageHandler available before the page calls it?
- Do URL Scheme redirects keep their callback parameters?
Debug iOS WebView-like environments with DebugAnywhere
DebugAnywhere helps you reproduce iPhone and iOS WebView-like issues on a real device by opening the target page, inspecting console output and request behavior through an injected panel, switching User-Agent, checking cookies and storage, applying environment headers, injecting JavaScript, and testing URL Scheme flows.