Custom Headers Debugging Guide
How to Use Custom Headers to Debug Mobile APIs
Custom headers help you reproduce staging, gray release, tenant, authentication, experiment, and app-context API behavior on a real mobile device. They are especially useful when a mobile page or WebView depends on headers added by the host app, gateway, or test environment.
Quick answer: how should you debug with custom headers?
Use custom headers when the mobile page needs app context that is not visible in the URL. Define the smallest set of headers needed to reproduce the environment, open the page on a real device with those headers applied to the initial request, verify the final URL, then inspect API requests, cookies, storage, and backend logs to confirm whether the request hit the expected environment, tenant, experiment, or authorization path.
When custom headers matter on mobile
Many mobile web and WebView systems depend on headers that are added outside the frontend page. A gateway may route by header. A backend may enable a feature flag by header. A native app may add version, tenant, locale, or authorization context before loading the WebView.
- The same URL hits production on one phone and staging on another.
- An API works in desktop Postman or curl but fails in the mobile page.
- A gray release, experiment, or tenant-specific feature only appears with a special header.
- The WebView host app normally adds app version, channel, device, or auth headers.
- A backend team asks you to send a trace ID or debug flag with the request.
Custom headers debugging workflow
1. Identify which request needs the header
First decide whether the header must be present on the initial document request, static asset requests, API requests, or all of them. WebView header behavior can be tricky: headers applied to the first page load are not always automatically added to every subsequent fetch or XHR request.
2. Keep the header set small
Add only the headers required to reproduce the issue. Too many headers make debugging harder and may hide the real dependency. Start with environment, authorization, feature flag, tenant, app version, and trace headers.
X-Debug-Env: staging
X-App-Version: 1.8.0
X-Feature-Flag: checkout_v2
X-Trace-Id: mobile-debug-20260703
3. Open the page on the real device
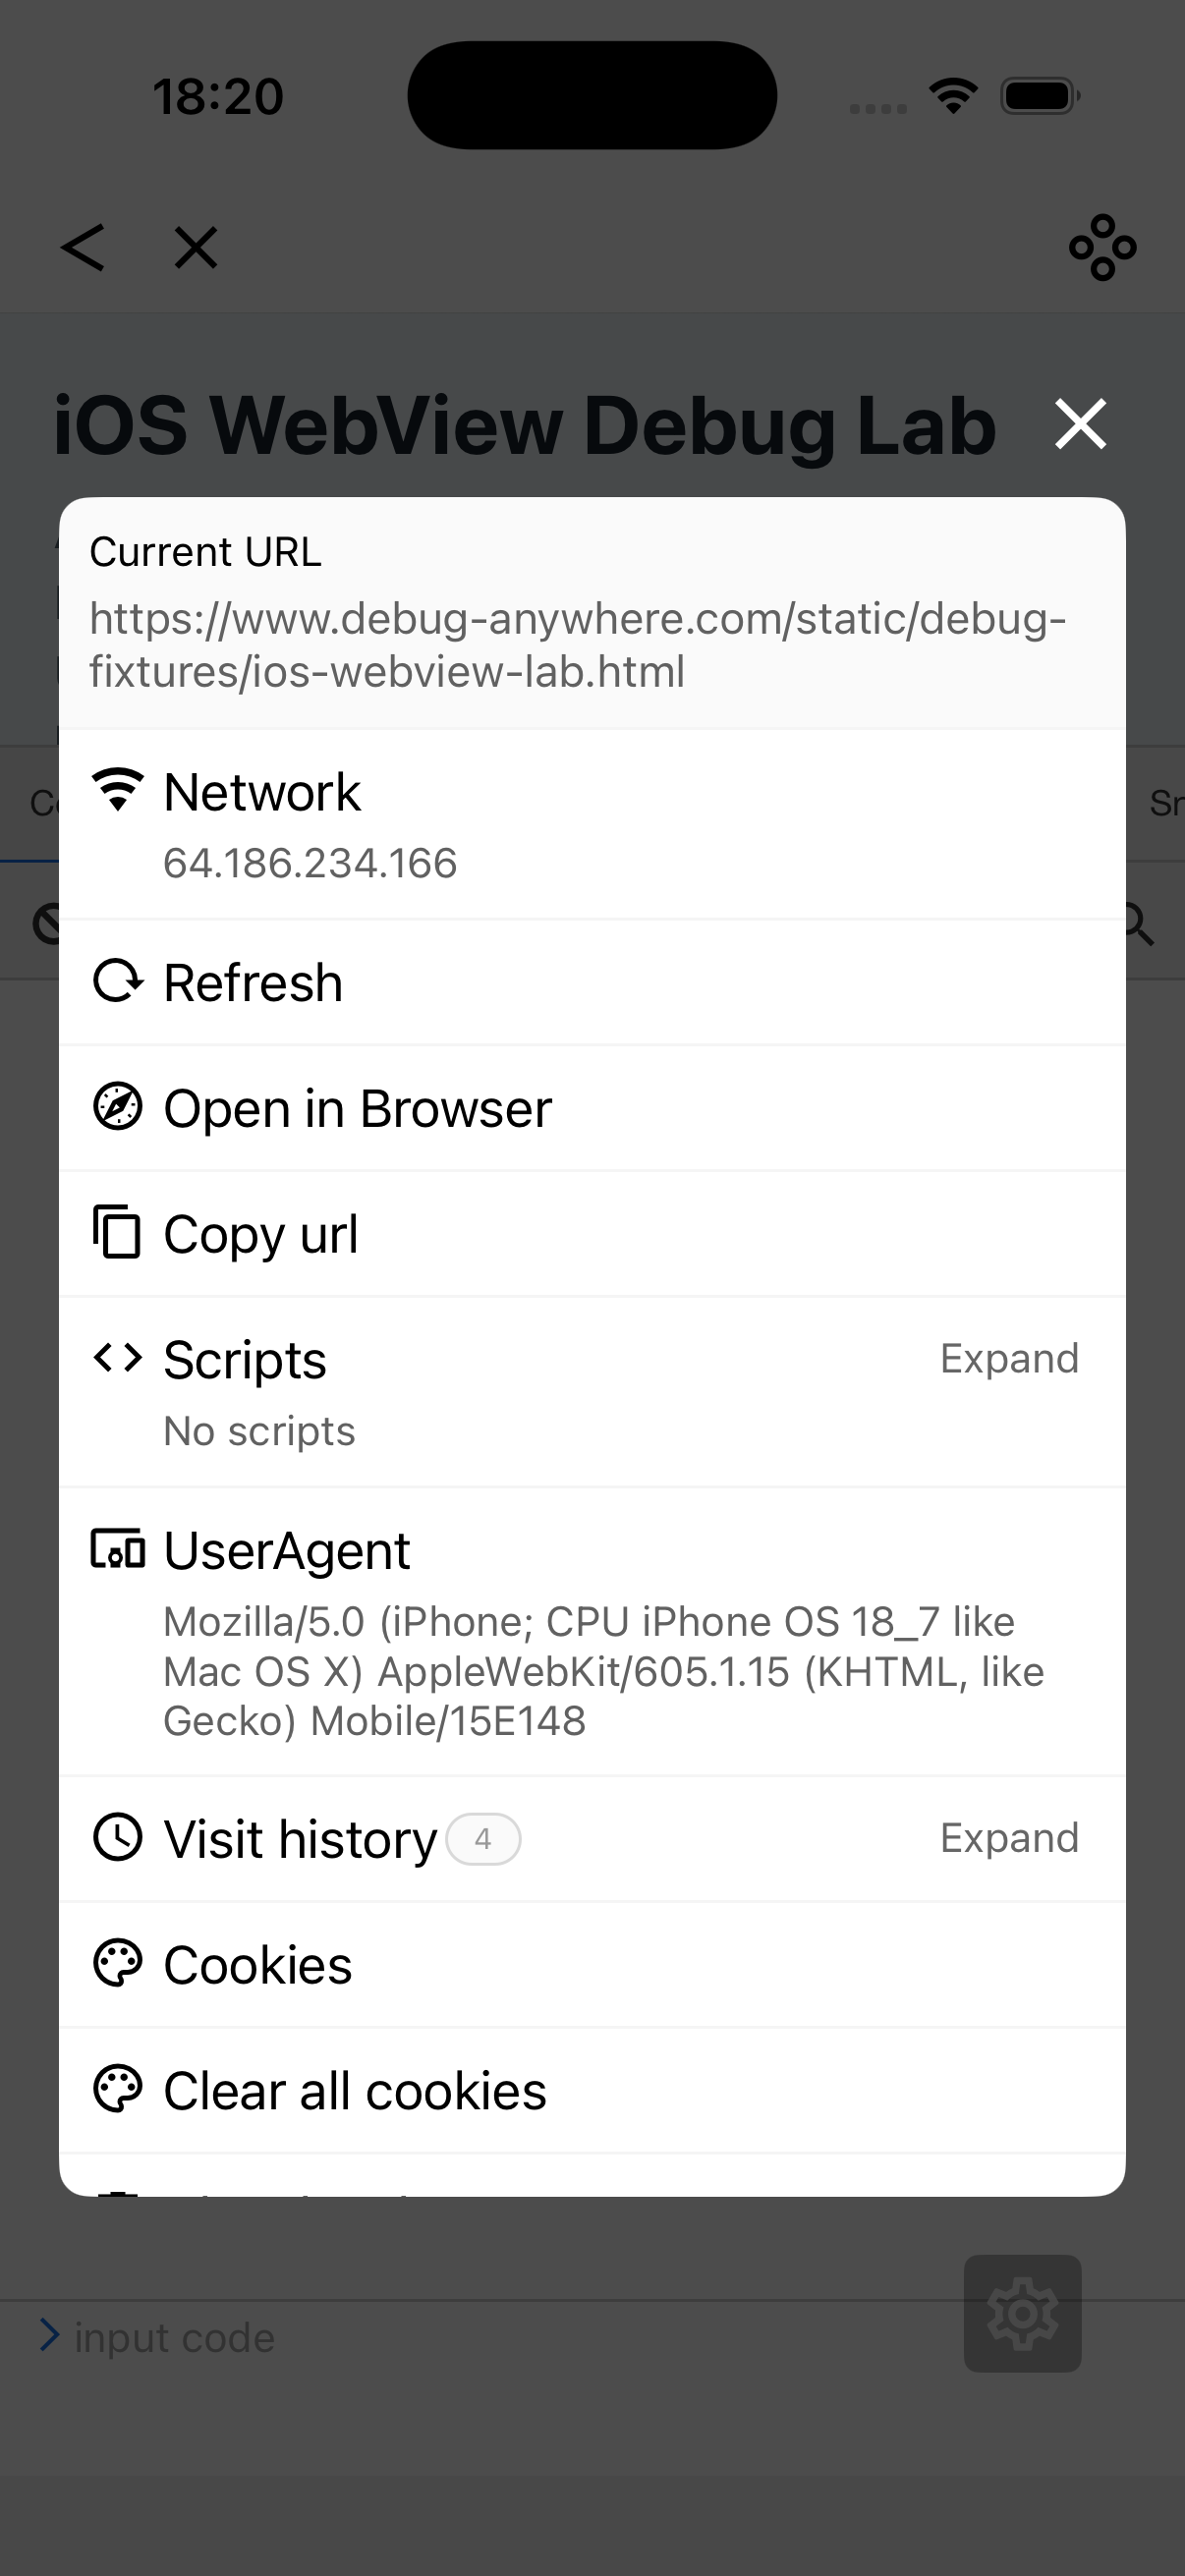
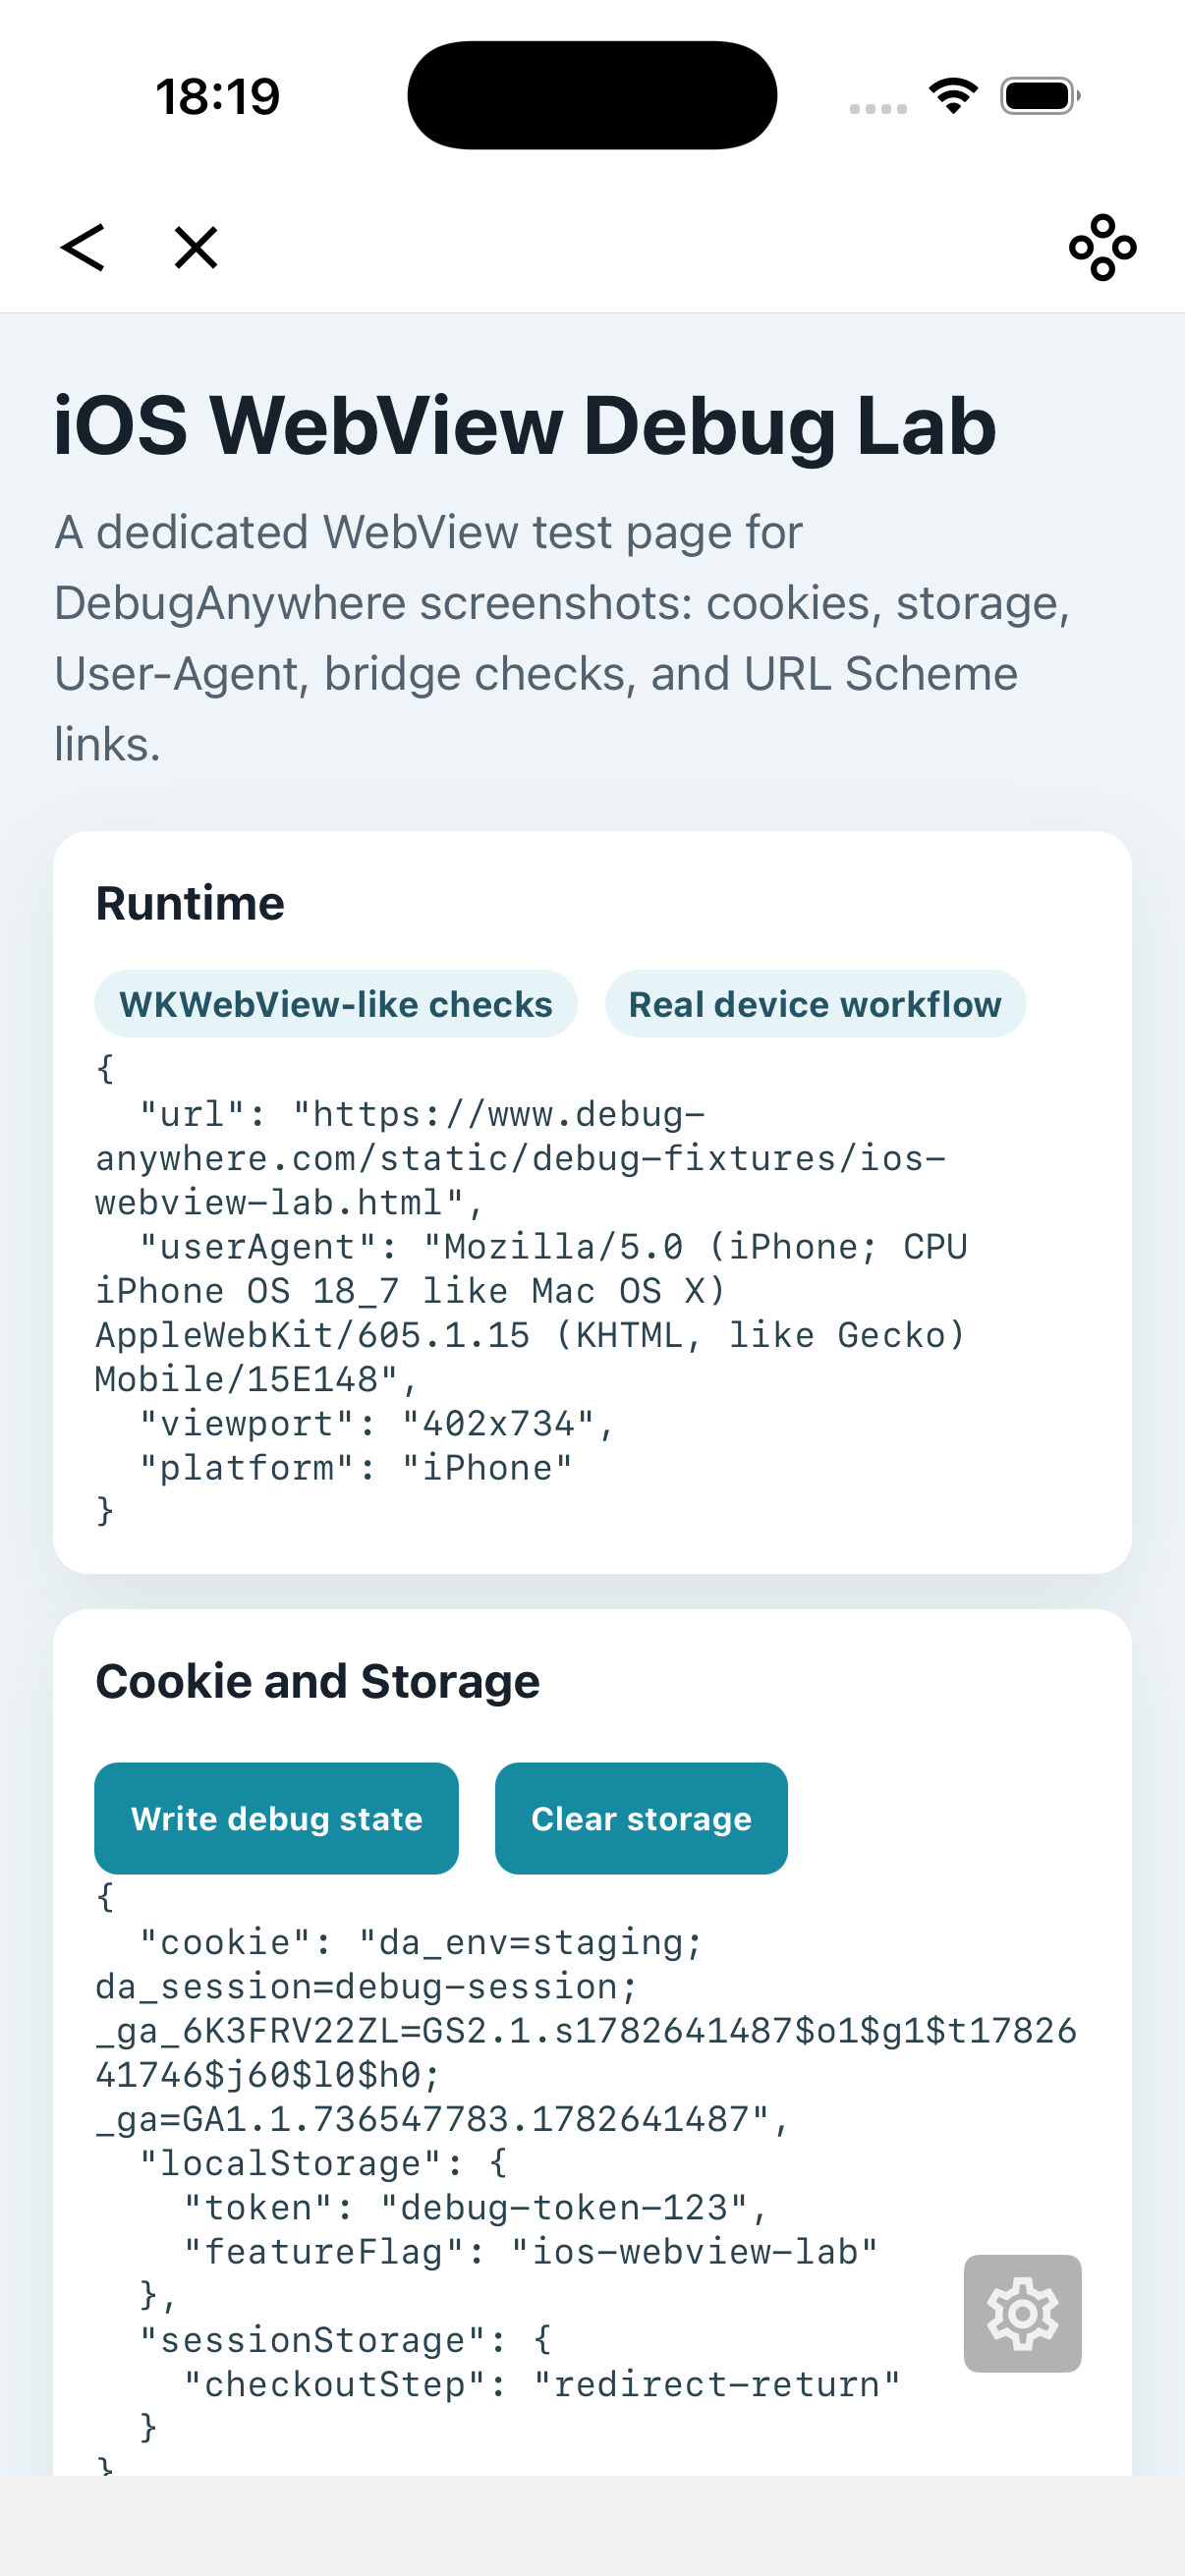
Use the same device, account, network, and entry URL where the bug occurs. If you use DebugAnywhere, configure the environment headers, open the URL, and then inspect the runtime using the debug tools menu.
4. Verify backend routing
Check whether the backend actually received the expected headers. Do not rely only on the frontend. Use backend logs, a request echo endpoint, gateway logs, or a temporary trace ID. This is especially important for staging, gray release, and tenant routing.
5. Separate initial-load headers from API headers
If the initial HTML request receives the header but later API calls do not, the page may need to attach headers in JavaScript, use credentials correctly, or rely on cookies instead. The right fix depends on whether the host app, gateway, or frontend owns the header.
Useful custom header examples
| Header type | Example | Use case |
|---|---|---|
| Environment | X-Debug-Env: staging | Route mobile page requests to a staging backend |
| Feature flag | X-Feature-Flag: checkout_v2 | Enable a gray release or experiment path |
| App context | X-App-Version: 1.8.0 | Reproduce app-version-specific WebView behavior |
| Trace | X-Trace-Id: mobile-debug-123 | Find the request in backend logs |
Common custom header debugging failures
| Symptom | Likely cause | What to check |
|---|---|---|
| Initial page works, API still fails | Headers were only applied to the document request | XHR/fetch headers, cookies, and backend auth mode |
| Backend cannot find the trace ID | Gateway stripped or renamed the header | Gateway allowlist and server logs |
| Staging header has no effect | Routing depends on host, cookie, or query instead | Environment routing rules |
| Works on Wi-Fi but not cellular | Network, proxy, DNS, or gateway difference | Network type and final API host |
Custom headers mobile debugging checklist
- Do you know which request needs the custom header?
- Did you keep the header set small enough to isolate the issue?
- Can the backend confirm it received the expected header values?
- Are document request headers and API request headers different?
- Does the issue depend on cookies, localStorage, or User-Agent instead of headers?
- Did you use a safe test account and avoid sharing real secrets?
Use DebugAnywhere to test mobile headers on real devices
DebugAnywhere helps you open mobile pages with environment context, inspect the page on the device, compare User-Agent behavior, check cookies and storage, and reproduce WebView-like API bugs without waiting for a new app build.